
Customer lifetime value (CLV) tells you whether the customers you acquire will create lasting value for your business. Yet for many ecommerce teams, it remains a once-a-year planning metric — calculated in a spreadsheet, used to set an acquisition budget, and then left behind.
That leaves a major opportunity on the table. CLV can do more than tell you how much to spend to acquire a customer. Used well, it can help you identify future VIPs, spot customers at risk of leaving, and make every campaign, offer, and retention investment more relevant.
Most guides hand you a formula and an average. This guide goes further, covering the four decisions that turn CLV into a number you can act on: the right time window, whether returns count, whether you need an average or a score for each customer, and whether you are measuring the past or predicting the future.
Research from Bain & Company shows why this approach is crucial: A 5% increase in customer retention increases profits by 25-95%. Despite this, too many companies still treat CLV as a secondary metric, underutilizing a measurement that directly connects customer relationships to long-term revenue.
- CLV is the value a customer represents to a company over a period of time, and it is a definition with four choices baked in, not a single universal number.
- A simple CLV can be calculated by multiplying the average annual profit of a customer by the average duration of customer retention.
- Customer lifetime value is important because it informs how much your company can (and should) spend on customer acquisition.
- The average tells you what to spend, and a per-customer predicted value tells you who to spend it on.
What Is Customer Lifetime Value (LTV)?
Customer lifetime value (CLV or CLTV) is a core metric for businesses. It shows the anticipated total revenue a business can derive from a single customer account over the course of their entire relationship.
According to McKinsey, CLV serves as a “customer compass” that guides investment decisions across acquisition, retention, and engagement. This metric takes into account the revenue generated by a customer and aligns it with the anticipated duration of the business relationship.
You can calculate a simple customer lifetime value model for your company with this formula:
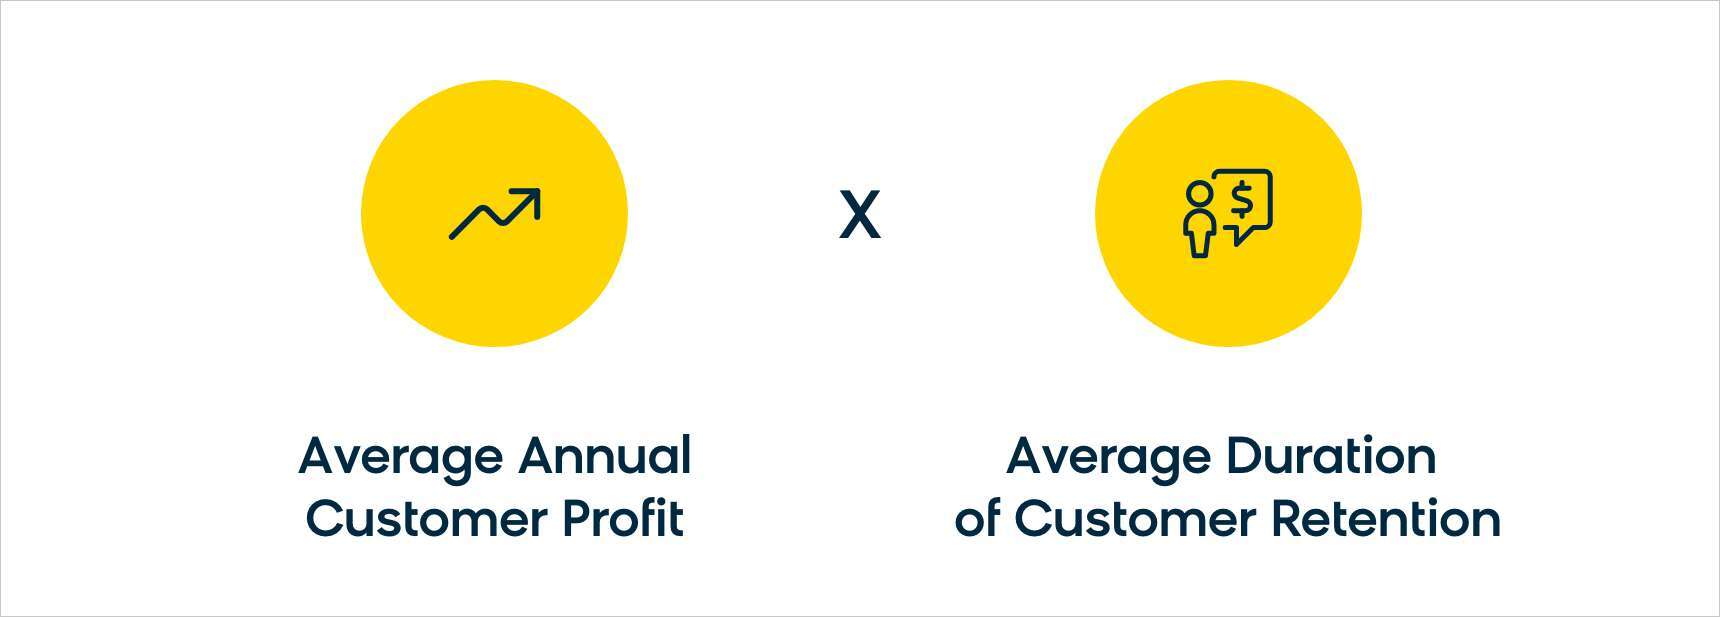
There are other methods of calculating customer lifetime value that get much deeper and can focus on the average customer or an individual customer. This article covers the importance of CLV and a customer lifetime value formula you can use to find it. It then shows the actionable ways you can use it to measure customer lifetime and improve your business.
What Is the Difference between CLV and LTV?
CLV and LTV are both used as shorthand for customer lifetime value, and they essentially share the same meaning. There’s no industry-established difference between the terms, and marketers often use them interchangeably.
Some people differentiate between CLV and LTV in terms of specificity. In that reading, CLV identifies the value of an individual customer over their entire relationship with a brand, and LTV refers to the average customer lifetime value of all existing customers.
But without company-specific factors for any one business’ calculations, this small degree of differentiation essentially produces the same metric, which is why the terms are understood to be identical.
Four Decisions That Make CLV a Number You Can Act On
There is no single, universal way to calculate customer lifetime value. Two teams can use the same formula and still reach very different answers — because the result depends on the decisions they make before doing any math.
These decisions determine whether CLV is simply a number for annual planning or a tool your team can use to make smarter marketing decisions every day.
1. Define What “Lifetime” Means for Your Business
“Lifetime” can mean the past 12 months, the first 24 months after a customer is acquired, or a projected relationship based on churn rate. The right choice depends on how often your customers typically buy.
A 12-month window may work for a fashion retailer. It will tell you very little about a mattress brand whose customers may not purchase again for years.
Choose a time frame that reflects your normal repurchase cycle. And when comparing customers, measure everyone over the same point in their relationship with your brand. Otherwise, a customer who joined last week and a customer who has been loyal for six years end up in the same average — and neither is represented accurately.
2. Decide What Counts as Customer Value
Revenue alone does not always tell the full story. A customer who spends heavily but returns half of their orders may look more valuable than a steady customer who keeps what they buy. Likewise, a deeply discounted first purchase can inflate value even if it produced little or no profit.
For a more accurate view, calculate CLV using net revenue — after returns and cancellations. Where possible, go further and use margin by accounting for cost of goods.
That means building your calculation on completed, successful purchases rather than every order placed. Bloomreach’s customer lifetime value dashboard, for example, separates successful purchases from canceled and returned orders before calculating value.
3. Choose Between an Average and an Individual Customer Score
Average CLV is useful for setting acquisition budgets. It helps answer a big-picture question: How much can we afford to spend to acquire a customer?
But it cannot tell you what to do next for a specific person. It won’t identify which customer deserves a VIP offer, which customer may respond to an incentive, or which customer is beginning to disengage.
For that, you need an individual value score that lives on each customer profile and updates as behavior changes. Without it, teams risk treating yesterday’s best customers as today’s highest priority — while customers whose value is rising right now receive the same generic messaging as everyone else.
4. Decide Whether You’re Looking Back or Looking Ahead
Historic CLV tells you what a customer has already contributed. It is useful for understanding past performance, reporting on customer segments, and setting benchmarks.
Predictive CLV estimates what a customer is likely to contribute next. That makes it more useful for action: identifying emerging VIPs, protecting customers at risk of churn, and deciding where to invest your marketing budget before revenue is lost.
Historic vs. Predictive Customer Lifetime Value
There are two main approaches to measuring customer lifetime value, and understanding the difference is critical for building an effective CLV strategy.
Historic CLV calculates a customer’s value based on past purchase data. It sums up the gross profit from all previous transactions a customer has made, giving you a concrete, backward-looking number. Historic CLV is straightforward to calculate and useful for understanding what has already happened, but it assumes the future will mirror the past.
Predictive CLV uses machine learning and statistical modeling to forecast the future value a customer will generate over the remainder of their relationship with your brand. Predictive models factor in purchase frequency trends, recency of engagement, average order value trajectories, and behavioral signals like browsing patterns and email engagement. The result is a forward-looking score. It identifies which customers are likely to become your most valuable, and which are at risk of churning, before it happens.
For ecommerce brands, predictive CLV is where the real strategic advantage lies. It enables you to allocate marketing spend toward customers with the highest projected value and intervene early with customers showing signs of disengagement.
In practice, a prediction is a probability attached to each customer profile. A churn prediction, for example, asks whether each customer will make another purchase within a window you choose: a week, a month, 90 days, or a year. It trains on the activity you define, such as purchases for retail, app opens for mobile-first brands, or renewals for subscriptions. It then writes a probability between 0 and 1 to the profile. Loomi’s predictive marketing analytics run these models with scores that update continuously as behavior changes.
Why Is Customer Lifetime Value Important?
Customer lifetime value calculations will get you one answer, but the knowledge you gain can be applied in a multitude of ways:
It Informs How Much You Should Spend on Customer Acquisition
Your customer acquisition costs (CAC) may very well equal more than you make from a customer’s first purchase. But that doesn’t take into account the average customer lifespan; are you still making money from that customer in the long run?
Figuring out the average lifetime value of a customer to your company will give you the answer. The economics favor retention: Acquiring a new customer costs 5-25x more than retaining an existing one, according to Harvard Business Review. Every dollar you invest in understanding and improving CLV pays for itself many times over.
It Allows You To Segment Your Customers Based on Value
“Using CLV, you can better understand the different personas among your customers — the first step to effective targeting or personalization.”
Daniar Rusnak | Bloomreach Academy, Senior Trainer
Calculating your CLV allows you to narrow your marketing focus for more effective campaigns. When you know how valuable a customer is in the long term, you can create better interactions with your high-value customers and foster more meaningful engagement.
You can send a special offer or gift to your “VIP” customers, or focus on acquiring new customers with similar backgrounds. You can also nurture less valuable customers and start upselling to build a high customer lifetime value. Viewing your audience through customer segments allows for a personalized experience, which is essential to keep your customer retention rates high.

Focusing on CLV Is Key for Long-Term Company-Wide Growth
It’s a competitive market for ecommerce companies, and price isn’t the only determining factor in a customer’s decisions.
CLV is a customer-centric metric, and one that depends on giving your audience a great customer experience. It’s a powerful base metric to build upon to retain customers, increase revenue from less valuable customers, and improve the customer experience overall.
The long-term payoff is significant: Bain & Company found that customers spend 67% more in months 31-36 of a relationship compared to their first six months. The longer you keep customers, the more valuable they become.
The Process of Finding Your CLV Is Valuable
“The advantage of determining customer lifetime value is not just the final number itself, but also the thinking and calculation behind the metric.”
Lukas Sitar | Inbound Marketing Specialist
Determining your business’ CLV or LTV provides more than one statistic. The process of finding your customer lifetime value will make you think about the full customer journey, beyond the sale itself. When, where, why, for how much, and how often do your customers make a purchase?
Answering these questions will lay out clear ways to strengthen your customer journeys, and help you spot issues in your customer engagement plan that you may not have noticed before.
How to Calculate Customer Lifetime Value? (With Examples)
There are four KPIs that determine your LTV: average order value (AOV), purchase frequency (F), gross margin (GM), and churn rate (CR).
With all these metrics, you can use this formula to calculate customer lifetime value:
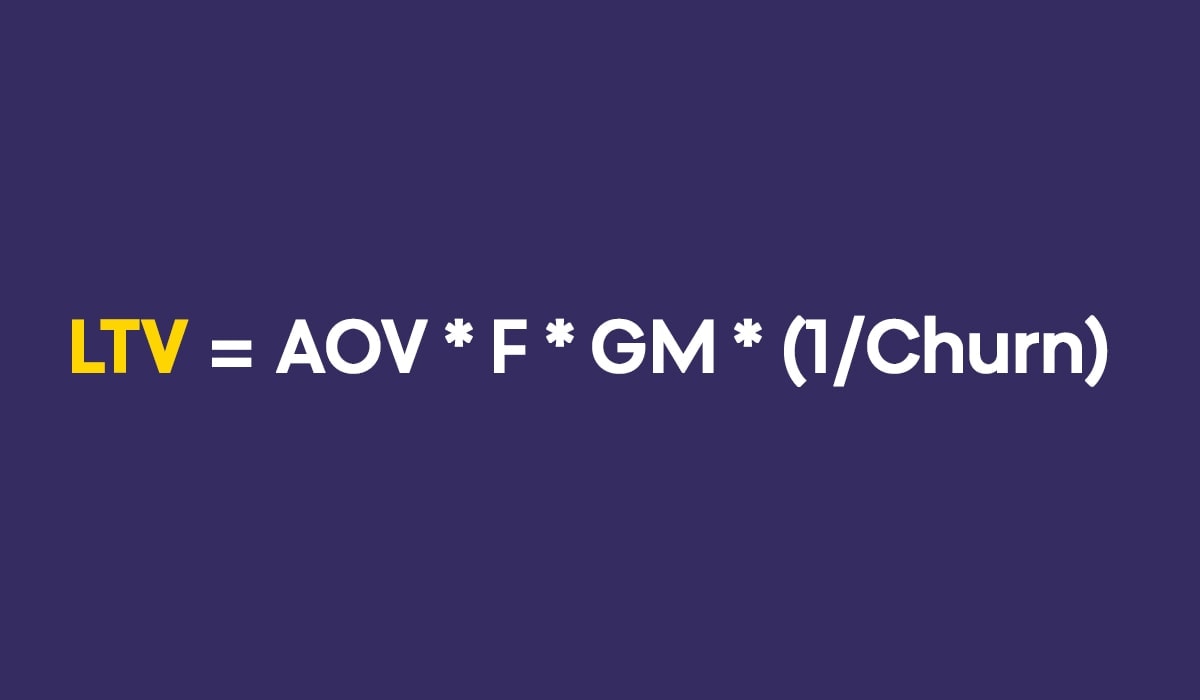
This is the simple formula from the top of the guide, expanded. AOV multiplied by purchase frequency and gross margin is the average annual profit per customer, and 1 divided by the churn rate is the average retention period.
With this customer lifetime value model, all you need to do is break down the equation to identify each factor and plug them all into the formula.
It’s important to look at each of these KPIs individually and determine their specific values before plugging them into the equation. This will help determine which one needs the most work in terms of profit maximization.
Clean the Data Before You Calculate
Your CLV is only as reliable as the purchase data behind it. A few common data issues can quietly distort your results, pushing the wrong customers to the top of your value rankings.
Watch for these four:
- Resellers and bulk buyers. They dominate a revenue-ranked list, but a VIP program was never designed for them.
- Serial returners. They look like your best customers until returns are deducted.
- Imported transactions. These often carry the import date rather than the actual purchase date, which distorts timing and frequency.
- Intent-based “purchase” events. Some events record an attempted purchase rather than a completed payment, inflating both order counts and revenue.
The usual warning sign is a customer value report that doesn’t reconcile with your finance numbers.
The fix is straightforward: apply explicit filters before you calculate. Filter on order status to count only completed purchases, cap order count per period to catch bulk buyers, and flag trade accounts so they’re handled separately.
Do this before you run the numbers — and especially before you train any predictive model on them. A model built on flawed data will produce flawed scores, no matter how sophisticated the algorithm.
How to Calculate Your Average Order Value (AOV)
First, we need to calculate your AOV using this equation:
AOV = Total Sales Revenue / Total Number of Orders
Let’s walk through an example computation of Company A’s average order value:
AVERAGE ORDER VALUE ANALYSIS: COMPANY A
Total Sales Revenue (annual): $1,000,000
Total Number of Orders (annual): 40,000
1,000,000 / 40,000 = 25
Company A has an average order value of $25
How to Calculate Your Purchase Frequency (F)
Next, you need to calculate your purchase frequency, or the number of times a customer completes a purchase in a given period of time:
F = Total Number of Orders / Total Number of Unique Customers
Let’s continue our example to find Company A’s purchase frequency:
PURCHASE FREQUENCY ANALYSIS: COMPANY A
Total Number of Orders (annual): 40,000
Total Number of Unique Customers (annual): 15,000
40,000 / 15,000 = 2.67
Company A has a purchase frequency of 2.67
How to Calculate Your Gross Margin (GM)
Now you need your gross margin, a business’ profit percentage after subtracting all direct costs of producing or purchasing the goods or services it sells.
GM = (Total Sales Revenue – Cost of Goods Sold (COGS)) / Total Sales Revenue
To calculate your gross margin, you need to start by calculating the cost of goods sold (COGS) using this equation:
COGS = beginning inventory (inventory left from last year) + additional purchases during period cost – ending inventory (inventory left at the end of the year)
Here’s a walkthrough of these calculations using our Company A example:
GROSS MARGIN ANALYSIS: COMPANY A
Beginning Inventory: $180,000
Additional Purchases During Period: $570,000
Ending Inventory: $160,000
180,000 + 570,000 – 160,000 = 590,000
Company A has a Cost of Goods Sold of $590,000
Total Sales Revenue: $1,000,000
COGS: $590,000
(1,000,000 – 590,000) / 1,000,000 = 0.41
Company A has a gross margin of 41%
How to Calculate Customer Lifetime Period (1/Churn)
Now it’s time to identify your customer lifetime period. To do so, you first need to find your churn rate, or the share of customers who stop doing business with a company during a given period.
Churn Rate = # of Customers Lost During the Time Period / # of Customers at Beginning of Time Period
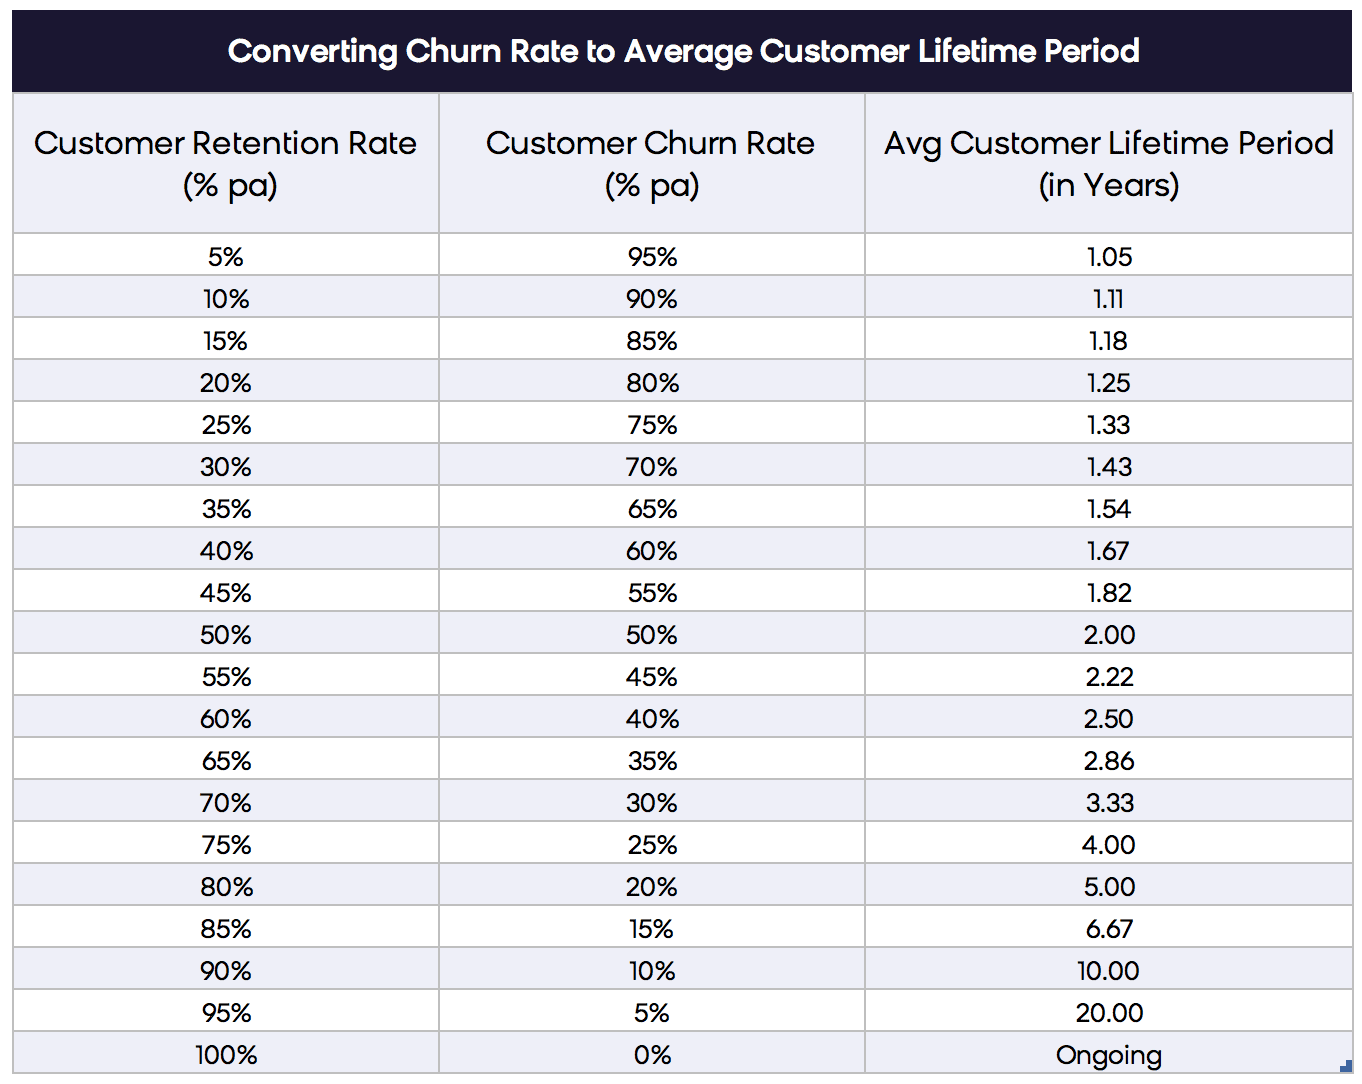
A customer counts as lost when they make no purchase for longer than your normal repurchase cycle, which is the same window decision from earlier in this guide. Once you calculate your churn rate percentage, you can determine your customer lifetime period.
You can plug your rate into the equation below or consult our corresponding chart to find your average customer lifetime period:
Customer Lifetime Period = 1/Churn Rate
Plugging All Your KPIs Into the Customer Lifetime Value Model
Now that we have all the factors needed, we can plug them all into the customer lifetime value formula. Here’s how the formula gets solved for our Company A example:
CUSTOMER LIFETIME VALUE ANALYSIS: COMPANY A
Average Order Value: $25
Average Purchase Frequency: 2.67
Gross Margin: 41%
Churn Rate: 60% -> Customer Lifetime Period: 1.67
25 (AOV) * 2.67 (F) * 0.41 (GM) * (1/0.6) = $45.7
Customer Lifetime Value is $45.7 (per customer)
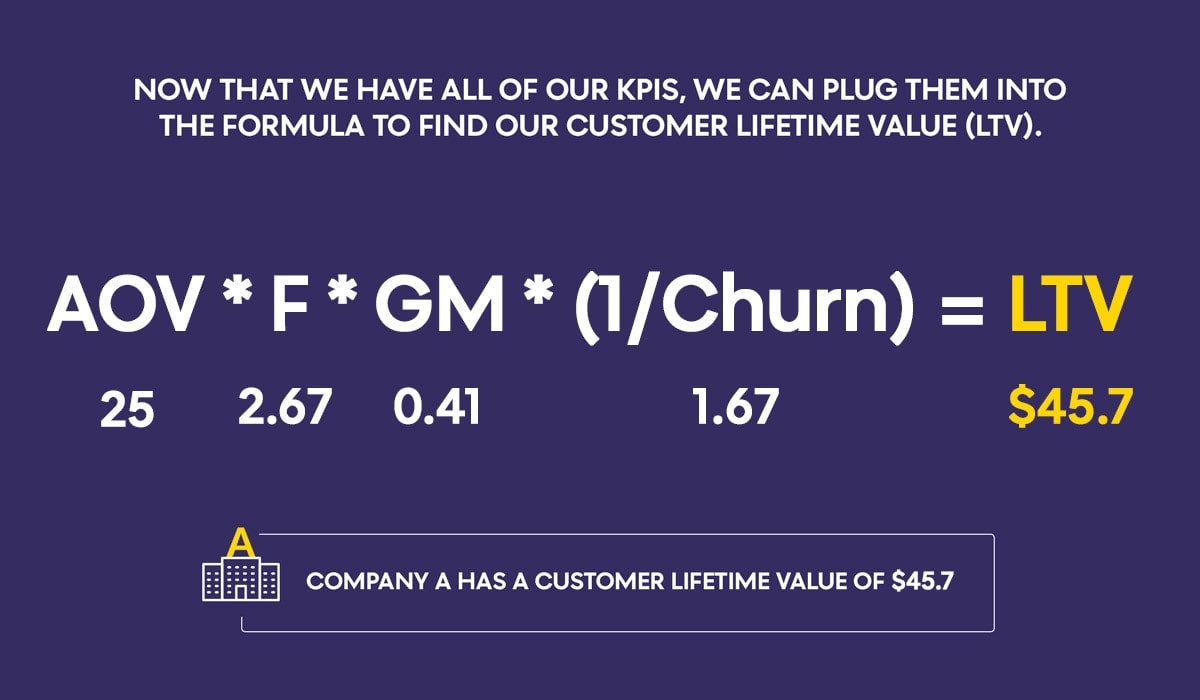
One check before you use the result: Company A’s revenue figure should be net of returns and cancellations, per decision two above. If it isn’t, the figure measures orders, when the point of the metric is customers.
How to Increase Your Customer Lifetime Value
With our KPIs ready, it’s time to work on our customer value maximization. But which of your KPIs are strong, and which ones need improvement? What is a good profit margin? What is a good purchase frequency?
Compare your KPIs with industry benchmarks to determine which KPI needs the most improvement. Finding current averages for your specific industry is essential because a good retail profit margin wouldn’t necessarily be a good food services profit margin. Bloomreach’s quarterly marketing benchmarks publish cart conversion and channel engagement by industry from real customer sends, a useful reference point for the frequency levers below.
Find current averages for your specific industry, then get to work on reaching and surpassing the standard metrics. Which one could improve customer value the most? Remember to focus on your weakest KPI first in order to maximize profit.
How To Improve Your Average Order Value (AOV)
Having trouble getting your customers to increase their spending? Try these campaigns, which focus on providing incentives to increase AOV.

- Add personalized product recommendations to your site. The recommended products should be based on the ideal price point for each individual customer, thereby maximizing revenue.
- Send personalized newsletter campaigns to customers with dynamic product recommendations optimized for price.
- Set up triggered product recommendations for customers based on what they’ve added to their shopping cart, directly on your website.
- Send an abandoned cart email campaign with product recommendations based on what they’ve added to their shopping cart.
- Create product bundles that offer a discount for making a larger purchase. Bundle products that can be used together and recommend the bundle directly on the site, or through email, based off the user’s browsing and shopping cart history.
- Create a customer loyalty program incentivizing spending by adding loyalty points that customers can use for discounts and freebies.
Real results: Sports retailer 11teamsports used Bloomreach’s personalization platform, Loomi, to build a loyalty program that drove a 35% higher average order value for members than guests. 87% of members bought within their first year. Points are calculated inside Loomi, so the program launched in Germany and then expanded to Austria and France without separate loyalty software.
How To Improve Your Purchase Frequency (F)
Maybe your customers spend a lot and you’re making a great margin, but they just don’t order very often. Try a few of these campaigns to maximize profit by nurturing long-term customer relationships.
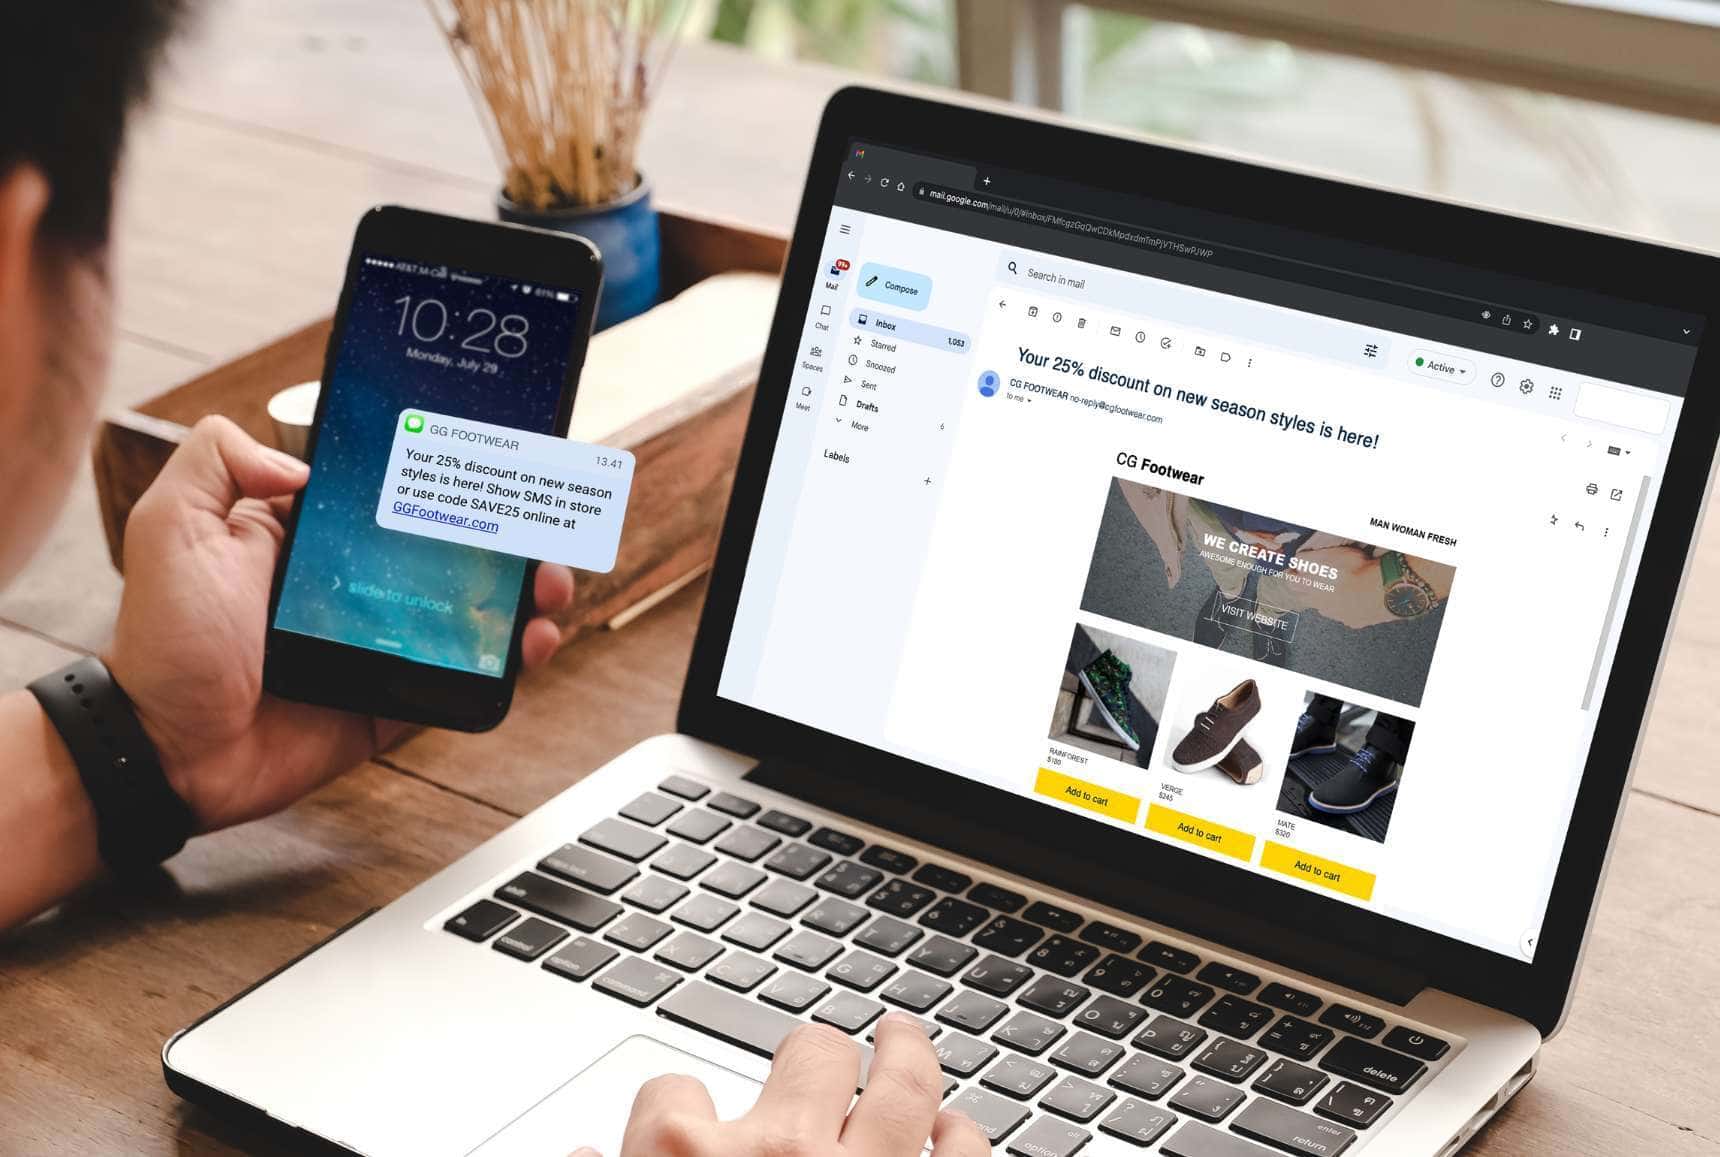
- Communicate dynamically and send emails at the ideal time for each customer, which you can achieve with a unified single customer view (SCV).
- Test and analyze your communications to figure out if you’re communicating through the right channels. Does this particular customer respond better to email or SMS? Make sure target customers receive your message through their preferred channel.
- Segment your customers by their customer lifecycle stage, then reengage with existing customers who haven’t purchased recently and are in danger of churning.
- Accelerate the second purchase. The first-to-second purchase rate is the frequency lever with the most headroom. A one-time buyer has a far higher chance of leaving than a two-time buyer. Run a purchase prediction on customers with exactly one order and put the incentive where it changes behavior.
- Use push notifications and banners to highlight time-sensitive deals based on a customer’s browsing history.
Real results: Popeyes UK turned to Bloomreach to create personalized, cross-channel campaigns that drove 3x repeat visits and an 8% increase in revenue. A QR code on every receipt let the brand match 20% of kiosk and till orders to a customer profile. The campaigns that followed turned occasional diners into regular customers.
How To Improve Your Gross Margin (GM)
It doesn’t matter how valuable your orders are or how frequently they happen if your gross margin doesn’t allow for a profit from the sales. Here are some ideas for profit improvement through increasing the average revenue you make on the sale.
- Use an inventory manager to make better estimates for what you’ll need to resupply your stock for the next year.
- Sell higher margin products. This is an easy way to maximize profit margins, and you can adjust your recommendation models to exclude products that are hurting your margins.
- Use a price optimizer to automatically find the ideal selling price for each of your products based on where they are in the product lifecycle. This will keep you informed of any products with more room for profit maximization.
- Stop discounting customers who would have bought anyway. Margin is lost when a blanket promotion reaches a customer with a high purchase probability. Score purchase probability first. Send full-price recommendations to the top tier, and reserve the incentive for the customers it will actually move.
- Strive to sell leftover products from the previous year to reduce your cost of goods sold.
How To Improve Your Churn Rate (Customer Lifetime Period)
Churn is a very complex metric, and there are many factors that combine to cause a customer to churn from your business. To decrease churn, you need to mainly focus on customer loyalty. Create incredible shopping experiences and your customers will stay with you.
- Set up reengagement campaigns that trigger when a customer’s churn probability crosses a threshold, rather than after a fixed number of inactive days. Timing is the advantage. A customer flagged the day their behavior changes can still be recovered, and a customer flagged 90 days later usually can’t.
- Create personalized email campaigns that utilize historical data to speak directly to customers’ wants and needs.
- Build a customer loyalty program encouraging spending with points and perks that loyal customers can use for discounts and freebies.
- Provide more ways for customers to engage with your brand by employing an omnichannel commerce strategy, offering consistent communication across channels and elevating customer experience.
Real results: Fashion retailer PrettyLittleThing used Loomi to build AI-powered reengagement campaigns that delivered a 133% increase in revenue per mobile push notification and a 30% increase in revenue per email. The trigger is each customer’s own purchase rhythm. When a shopper approaches or passes their usual gap between orders, Loomi sends a push with a relevant incentive. If there’s no action, it follows up by SMS or email on the channel that customer responds to.
How To Use Customer Lifetime Value and Increase Profitability
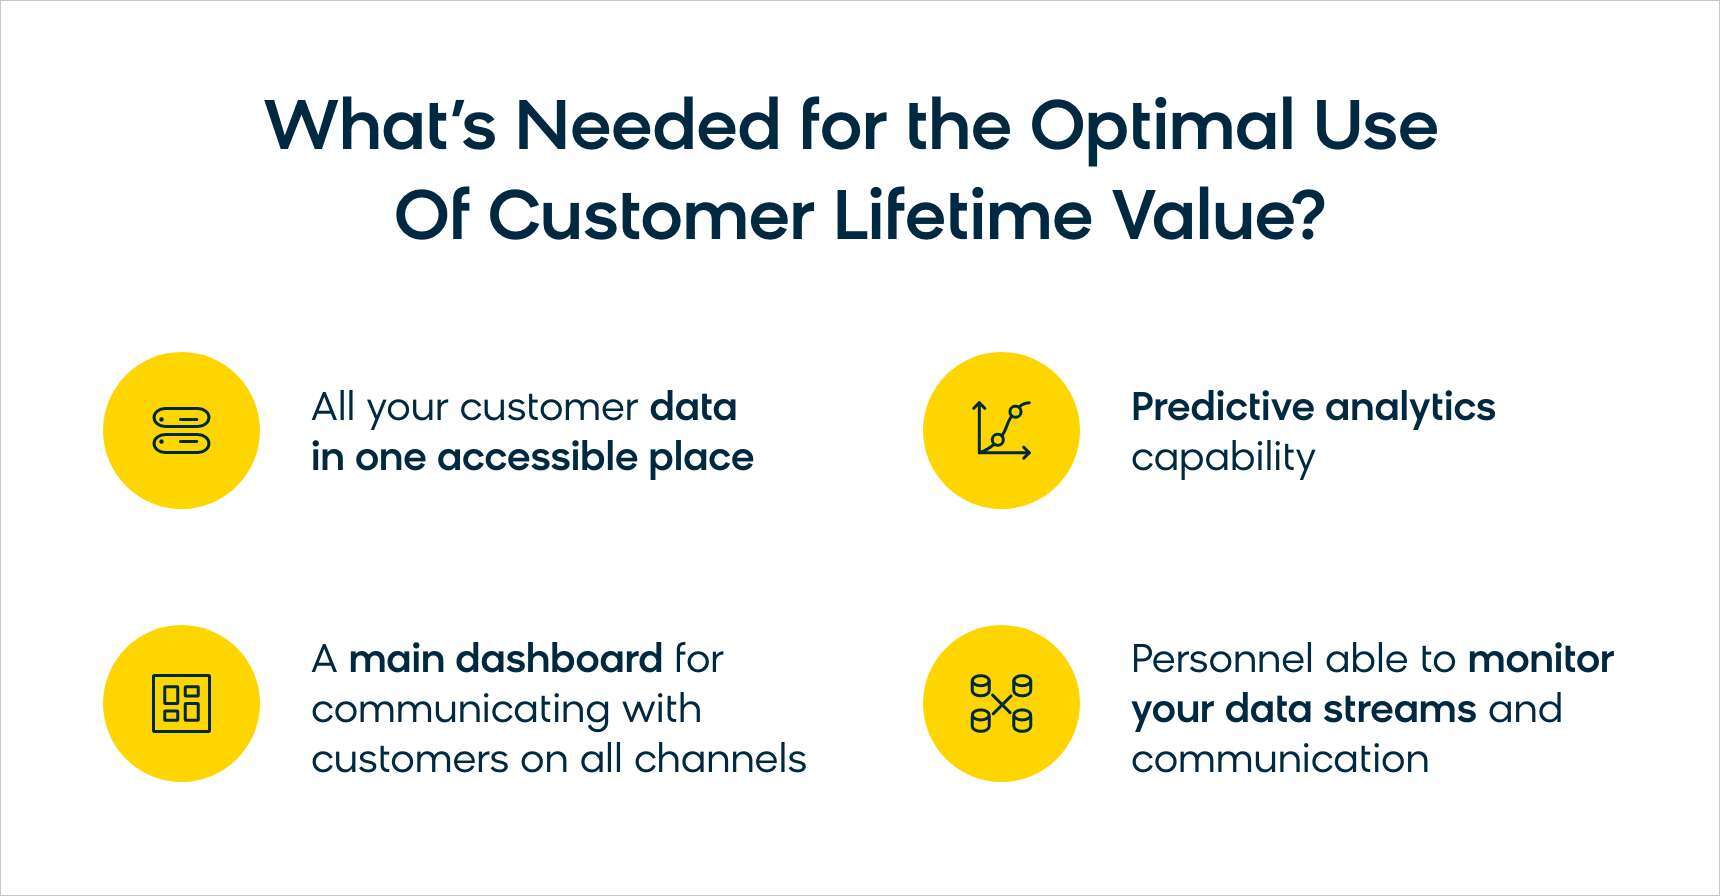
In order to get the most out of your CLV, there are some fundamental capabilities your business must have in your martech stack:
- Access to all your customer data in one place
- A unifying dashboard for communicating with customers on all channels
- Predictive analytics capabilities
- The ability to monitor your data streams and communication channels
Marketing technology has evolved to meet all these needs. With the rapid rise of artificial intelligence, your marketing team can organize, manage, and activate all your data.
Turn Scores Into Action
A value tier on its own is just a label. It becomes useful when you pair it with a second signal that tells you what to do next.
The most common pairing among Bloomreach customers is customer value + churn probability. Value tells you how much a customer is worth. Churn probability tells you how urgently you need to act. Together, they point to a specific treatment.
|
Churn probability |
Treatment
|
|---|---|
|
High (above 0.7) |
Omnichannel reengagement with a meaningful incentive. Email first with a personalized offer, then SMS or push if there is no engagement within two days. For high-value customers, escalate to service outreach. |
|
Medium (0.4 to 0.7) |
A softer reengagement email with personalized recommendations or new arrivals. A relevant product is usually enough at this stage, with no hard discount. |
|
Low (below 0.4) |
No intervention. Standard campaigns continue. |
These cutoffs are illustrative, not universal. Churn probability distributions vary by business, so set your own thresholds based on where your customers actually cluster.
The same logic protects your margin. One Bloomreach customer tested voucher amounts against purchase probability and found that medium-probability customers converted at 23.4% with a medium incentive, compared to 10.7% in the control group. High-probability customers converted at full price with no discount at all (see the documented results).
The takeaway: the promotional budget moved to the middle tier, where it actually changed behavior — instead of discounting customers who would have bought anyway.
Acquire High-Value Customers
When you know the characteristics and behaviors of your highest-value customers, you can use those insights to target similar prospects. Build lookalike audiences for your advertising campaigns based on customer data from your most valuable segments, and prioritize acquiring customers who are likely to generate the most long-term revenue.
The mirror image works too. Suppress customers with a high purchase probability from paid retargeting, because they will buy anyway, and spend that budget on the persuadable middle.
Secure Future VIPs
Use predictive analytics to identify customers who show early signs of becoming high-value. These customers may not be your biggest spenders yet, but their engagement patterns, such as frequent site visits, email opens, and repeat purchases, suggest they have the potential to become VIPs. Nurture them with tailored content and exclusive offers to accelerate their journey.
Practice Value-Tier Segmentation
Segment your customer base into value tiers (e.g., high, medium, low CLV) and customize your marketing strategies for each group. High-value customers might receive premium experiences and early access to new products, while lower-value segments could be targeted with campaigns designed to increase their engagement and spending over time.
Low observed value is often under-communication rather than low potential, so the default treatment for the bottom tier is more relevant contact before any discount.
Prevent Churn
By monitoring CLV trends and customer engagement metrics, you can identify at-risk customers before they churn.
Set up automated reengagement workflows that trigger when a customer’s churn probability crosses your threshold, offering personalized incentives to bring them back. Set the threshold from your own distribution. Run a report of churn probability against customer count, see where your customers cluster, and place the line there rather than at a round number.
Find Your Weak Point and Strengthen It
Your CLV calculation is made up of several KPIs. Identify which one is dragging your overall CLV down, whether it’s a low average order value, infrequent purchases, thin margins, or high churn. Focus your optimization efforts there for the biggest impact.
Plan Your Yearly Advertising Budget
CLV gives you a clear picture of how much revenue you can expect from a customer over their lifetime. That directly informs how much you can afford to spend on acquiring new customers. Use this data to allocate your advertising budget more effectively and ensure a positive return on investment.
Measure Your Ad Performance
Go beyond short-term metrics like click-through rates and cost per acquisition. Use CLV to evaluate the true long-term value of customers acquired through different advertising channels, campaigns, and creatives. This helps you invest more in the channels that bring in the most valuable customers over time.
Kiwi.com applied this approach with Bloomreach and saw a direct bottom-line impact. By using personalized campaigns informed by customer value data, Kiwi.com achieved an 8% revenue uplift from their personalization efforts, proving that CLV-driven marketing translates to measurable business results.
The same playbook applies outside retail: sportsbook marketing uses CLV to decide which bettors an acquisition bonus is worth paying for.
What Is the Relationship Between CAC and Customer Lifetime Value?
Understanding customer lifetime value is critical in its own right. But it is also one half of an important relationship for businesses to understand: the correlation between LTV and CAC.
Luckily, this correlation is easy to comprehend. Simply put, if you want to know if your ecommerce business is in good shape, your customer acquisition cost needs to be lower than your customer lifetime value.

If your CAC is higher than your CLV, you’re spending more to acquire customers than they’re worth to your business. This is unsustainable in the long run and signals a need to either reduce your acquisition costs or increase the value you’re getting from each customer.
A healthy LTV:CAC ratio is typically considered to be 3:1 or higher, meaning the lifetime value of a customer should be at least three times the cost of acquiring them. McKinsey’s research confirms this, finding that CLV-to-CAC ratios should fall between 2:1 and 8:1+ depending on business maturity, with more established companies achieving ratios at the higher end. This ratio ensures you have enough margin to cover operating costs, reinvest in growth, and maintain profitability.
To improve this ratio, you can work on both sides of the equation:
- Reduce CAC by optimizing your ad spend, improving conversion rates, using organic channels, and refining your targeting to attract higher-quality leads.
- Increase CLV by improving customer retention, boosting average order values, increasing purchase frequency, and enhancing the overall customer experience.
Tracking the LTV:CAC ratio over time also helps you understand the efficiency of your marketing investments and make data-driven decisions about where to allocate resources.
Want to see where you stand? Use the Bloomreach CAC/LTV Calculator to benchmark your ratio and identify opportunities for improvement.
How CLV Can Drive Business KPIs (Interview)

Bloomreach clients like Desigual use customer lifetime value to drive critical KPIs for their business. We sat down with Ricardo Gómez, Global Head of 365 Consumer Marketing at Desigual, to understand how Desigual improves its CLV.
BLOOMREACH: What is more important for Desigual: lowering customer acquisition cost or increasing customer lifetime value?
RICARDO: For us, increasing CLV is what matters the most. Our CAC is quite low compared to the business our customers bring to the brand. The biggest acquisitions we do are done when our customers buy and we invite them to join our members program. This is why we have to ensure we’re driving traffic to the stores and increasing the CLV of our database.
BLOOMREACH: What have you found to be the most challenging part of increasing your customers’ lifetime value?
RICARDO: Our CLV is very closely linked to the overall experience we offer and to the quality of the products we sell. Therefore, we largely increase our CLV by making sure there are no pain points, or if there are, that we address them quickly. We also do not send campaigns for products that have had or could have any quality issues.
Omnichannel campaigns are important too; we run several campaigns to move clients who shop offline only to buy online as well. This has a great impact for us.
Finally, we found a correlation between lowered customer value and lower-quality purchased products, so we stopped communications around those items and began to remove the garments we believed to be below our standards.
Why Don’t More Companies Use Customer Lifetime Value Effectively?
With so many benefits and insights to be gained with customer lifetime value models, it’s hard to believe that not every business utilizes the formula to its full potential. Here are some of the biggest roadblocks that companies face when trying to take advantage of CLV.
Many Established Companies Keep Their Data in Different Silos
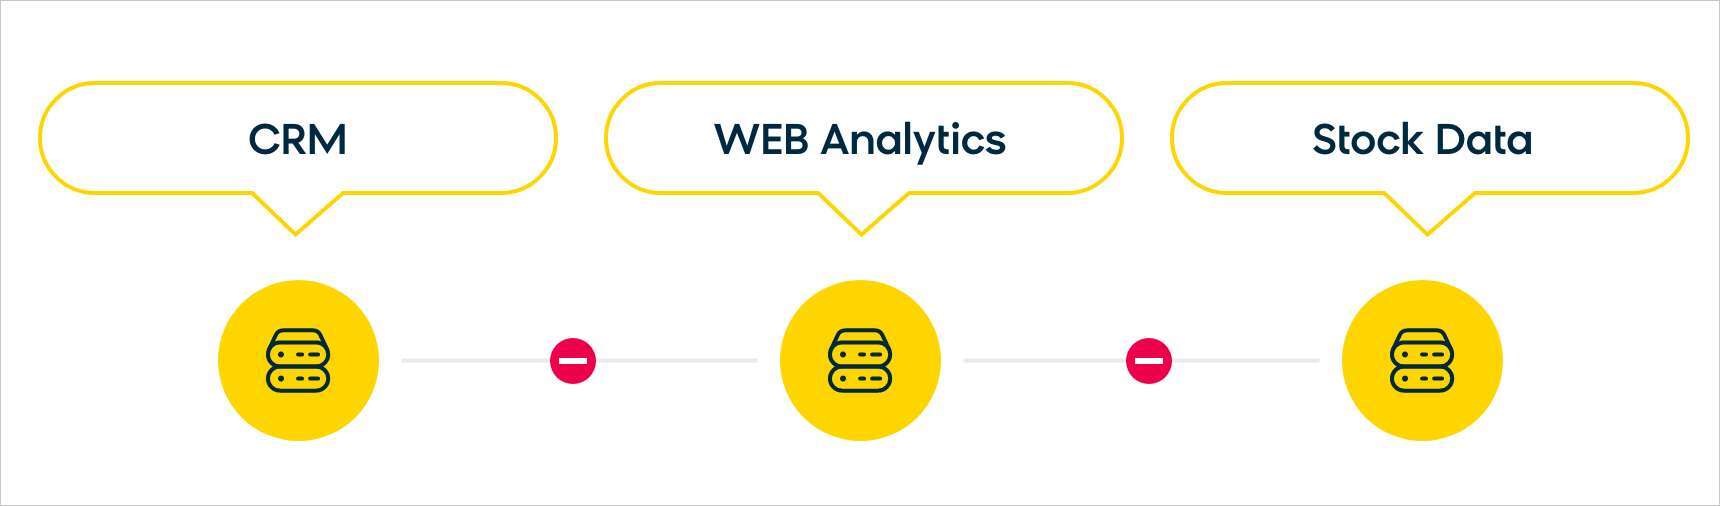
As companies grow, they often adopt different tools and platforms for different departments: one system for email marketing, another for customer service, a separate CRM, and yet another for analytics. This creates data silos where valuable customer information is scattered across disconnected systems.
When your data lives in silos, calculating an accurate CLV becomes extremely difficult. You can’t get a complete picture of a customer’s interactions, purchases, and engagement across all touchpoints. This fragmented view leads to inaccurate CLV calculations and missed chances to optimize.
The solution is to consolidate your data into a single, unified platform, with a customer data engine that brings together all your customer touchpoints, transactions, and behavioral data in one place.
Read This Next: A Single Customer view: Everything you Need To Know
Customers Now Make Purchases From Multiple Devices
Modern customers interact with brands across smartphones, tablets, laptops, and desktop computers. They might browse on their phone during lunch, add items to their cart on a tablet in the evening, and complete the purchase on a desktop the next morning.
This multi-device behavior makes it challenging to track a single customer’s journey accurately. Without proper identity resolution and cross-device tracking, a single customer might appear as multiple separate users in your data, leading to fragmented and inaccurate CLV calculations.
To overcome this challenge, businesses need identity resolution that can stitch together customer interactions across devices and channels into a single, unified customer profile.
Companies Lack In-House Skills and AI Technology
Calculating and effectively using CLV requires a combination of data science expertise, marketing knowledge, and the right technology stack. Many companies simply don’t have the in-house skills to build and maintain sophisticated CLV models.
As customer data grows in volume and complexity, manual CLV calculations become impractical. AI and machine learning are essential for processing large datasets, identifying patterns, and generating predictive CLV scores at scale. Many organizations haven’t yet adopted these technologies.
This is where Loomi closes the gap. The platform comes with built-in CLV dashboards and predictive analytics, making it possible for marketing teams to use CLV without needing a dedicated data science team. Loomi handles the modeling, pattern recognition, and real-time scoring automatically. It also reports each model’s accuracy, so the team can validate a prediction before it drives spend. Your team focuses on strategy, and Loomi handles the math.
Calculate and Maximize Your CLV With Bloomreach
Your CLV data is only as valuable as your ability to act on it. Loomi’s marketing automation turns CLV insights into personalized customer experiences across 13+ channels, including email, SMS, web, mobile app, push notifications, and ads.
Here’s what that looks like in practice:
- Unified customer data: All your customer interactions, transactions, and behavioral signals consolidated in a single platform, giving you the accurate, complete picture CLV calculations require.
- Predictive CLV analytics: Loomi forecasts individual customer value using machine learning models trained on your first-party data. It identifies future VIPs, flags at-risk customers, and scores every profile continuously.
- Real-time activation: Loomi moves from data ingestion to personalized action in 5ms-2s, so your campaigns respond to customer behavior as it happens, not on a next-day batch cycle.
- Compound personalization: Insights from one channel optimize every other touchpoint. A customer’s email engagement informs their web experience, which shapes their SMS offers, which feeds back into smarter CLV predictions. Each channel makes the others more effective.
Schedule a personalized demo to see how Loomi can help you calculate, maximize, and act on CLV. Or benchmark your current performance with the CAC/LTV Calculator.
FAQs
What is a good customer lifetime value?
A “good” CLV varies significantly by industry, product type, and business model. Rather than targeting a specific dollar amount, focus on the CLV:CAC ratio. McKinsey’s research shows healthy ratios range from 2:1 to 8:1+, with 3:1 as the most common benchmark. Use the Bloomreach CAC/LTV Calculator to benchmark your ratio against these targets.
What is the difference between CLV and LTV?
CLV (customer lifetime value) and LTV (lifetime value) refer to the same metric and are used interchangeably. Some marketers use CLV when discussing an individual customer’s value and LTV for the average across all customers, but there is no industry-standard distinction between them.
How does AI improve customer lifetime value?
AI improves CLV through predictive analytics, personalized recommendations, and automated reengagement. Specifically, AI can forecast which customers are likely to become high-value or at-risk of churning, then trigger personalized campaigns to retain and grow them. Loomi AI, Bloomreach’s intelligence platform, does this in real time across 13+ channels, using first-party data to continuously update CLV predictions and personalize every touchpoint.
What is the ideal CLV to CAC ratio?
The most widely cited benchmark is 3:1, meaning each customer should generate three times more value than it costs to acquire them. McKinsey finds that mature businesses often achieve ratios of 2:1 to 8:1+, depending on industry and retention rates. A ratio below 1:1 means you’re losing money on every customer acquired.
How often should you calculate customer lifetime value?
At minimum, recalculate CLV quarterly to track trends and adjust your marketing strategy. For best results, use a customer data platform with real-time analytics that updates CLV scores continuously as new data comes in. This allows you to respond to changes in customer behavior immediately rather than waiting for the next quarterly review.
What is predictive customer lifetime value?
Predictive CLV uses machine learning and AI to forecast a customer’s future value based on behavioral patterns, purchase history, and engagement signals. Unlike historic CLV (which calculates value from past transactions), predictive CLV looks forward, identifying which customers are likely to increase or decrease in value. This enables proactive retention marketing, where you act on signals before a customer churns.